About
Rivercity Tech — Managed IT Services & Operations Portal
Rivercity Technology Services LTD is a relationship-first Managed IT Services provider specializing in cybersecurity, business process optimization, and technology support. As part of their digital transformation, I redesigned their public website and created a complete internal MSP Operations Dashboard to help their team manage clients, tickets, performance metrics, devices, and security alerts with unmatched clarity.
- Managed IT Services
- UI/UX Design
- MSP Dashboard
- Cybersecurity
- Next.js
- Design System
- Portal UX


Website Redesign
The previous website lacked structure, clarity, and failed to communicate Rivercity’s relationship-driven identity. I rebuilt the experience with:
- Clear brand messaging focused on trust, transparency, and partnership
- SEO-optimized structure to increase organic visibility in Saskatoon
- Dedicated service pages for IT, cybersecurity, backups, VoIP, and hosting
- Consistent component library and scalable layout system
- Accessibility improvements (contrast, semantic layout, keyboard navigation)
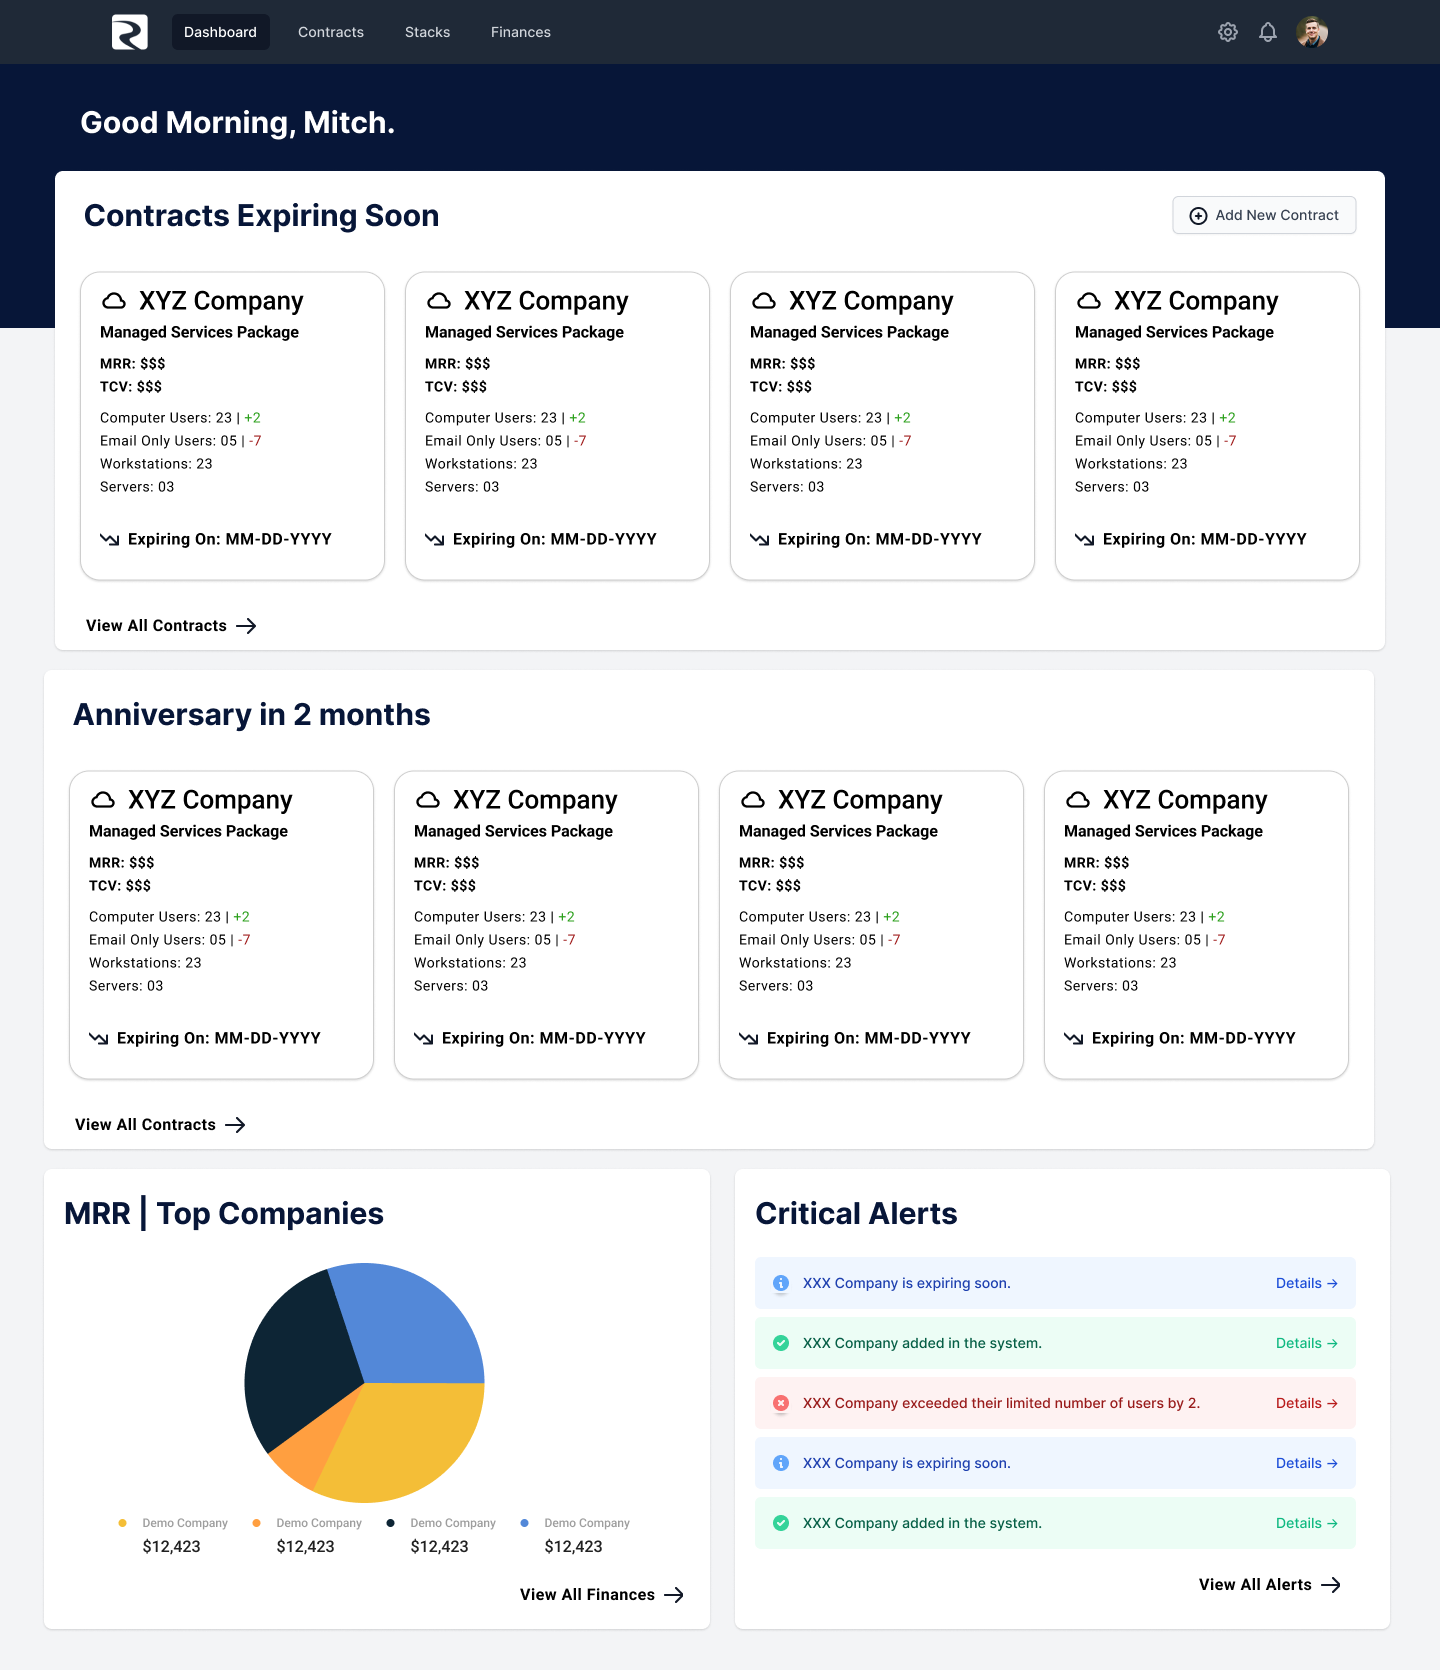
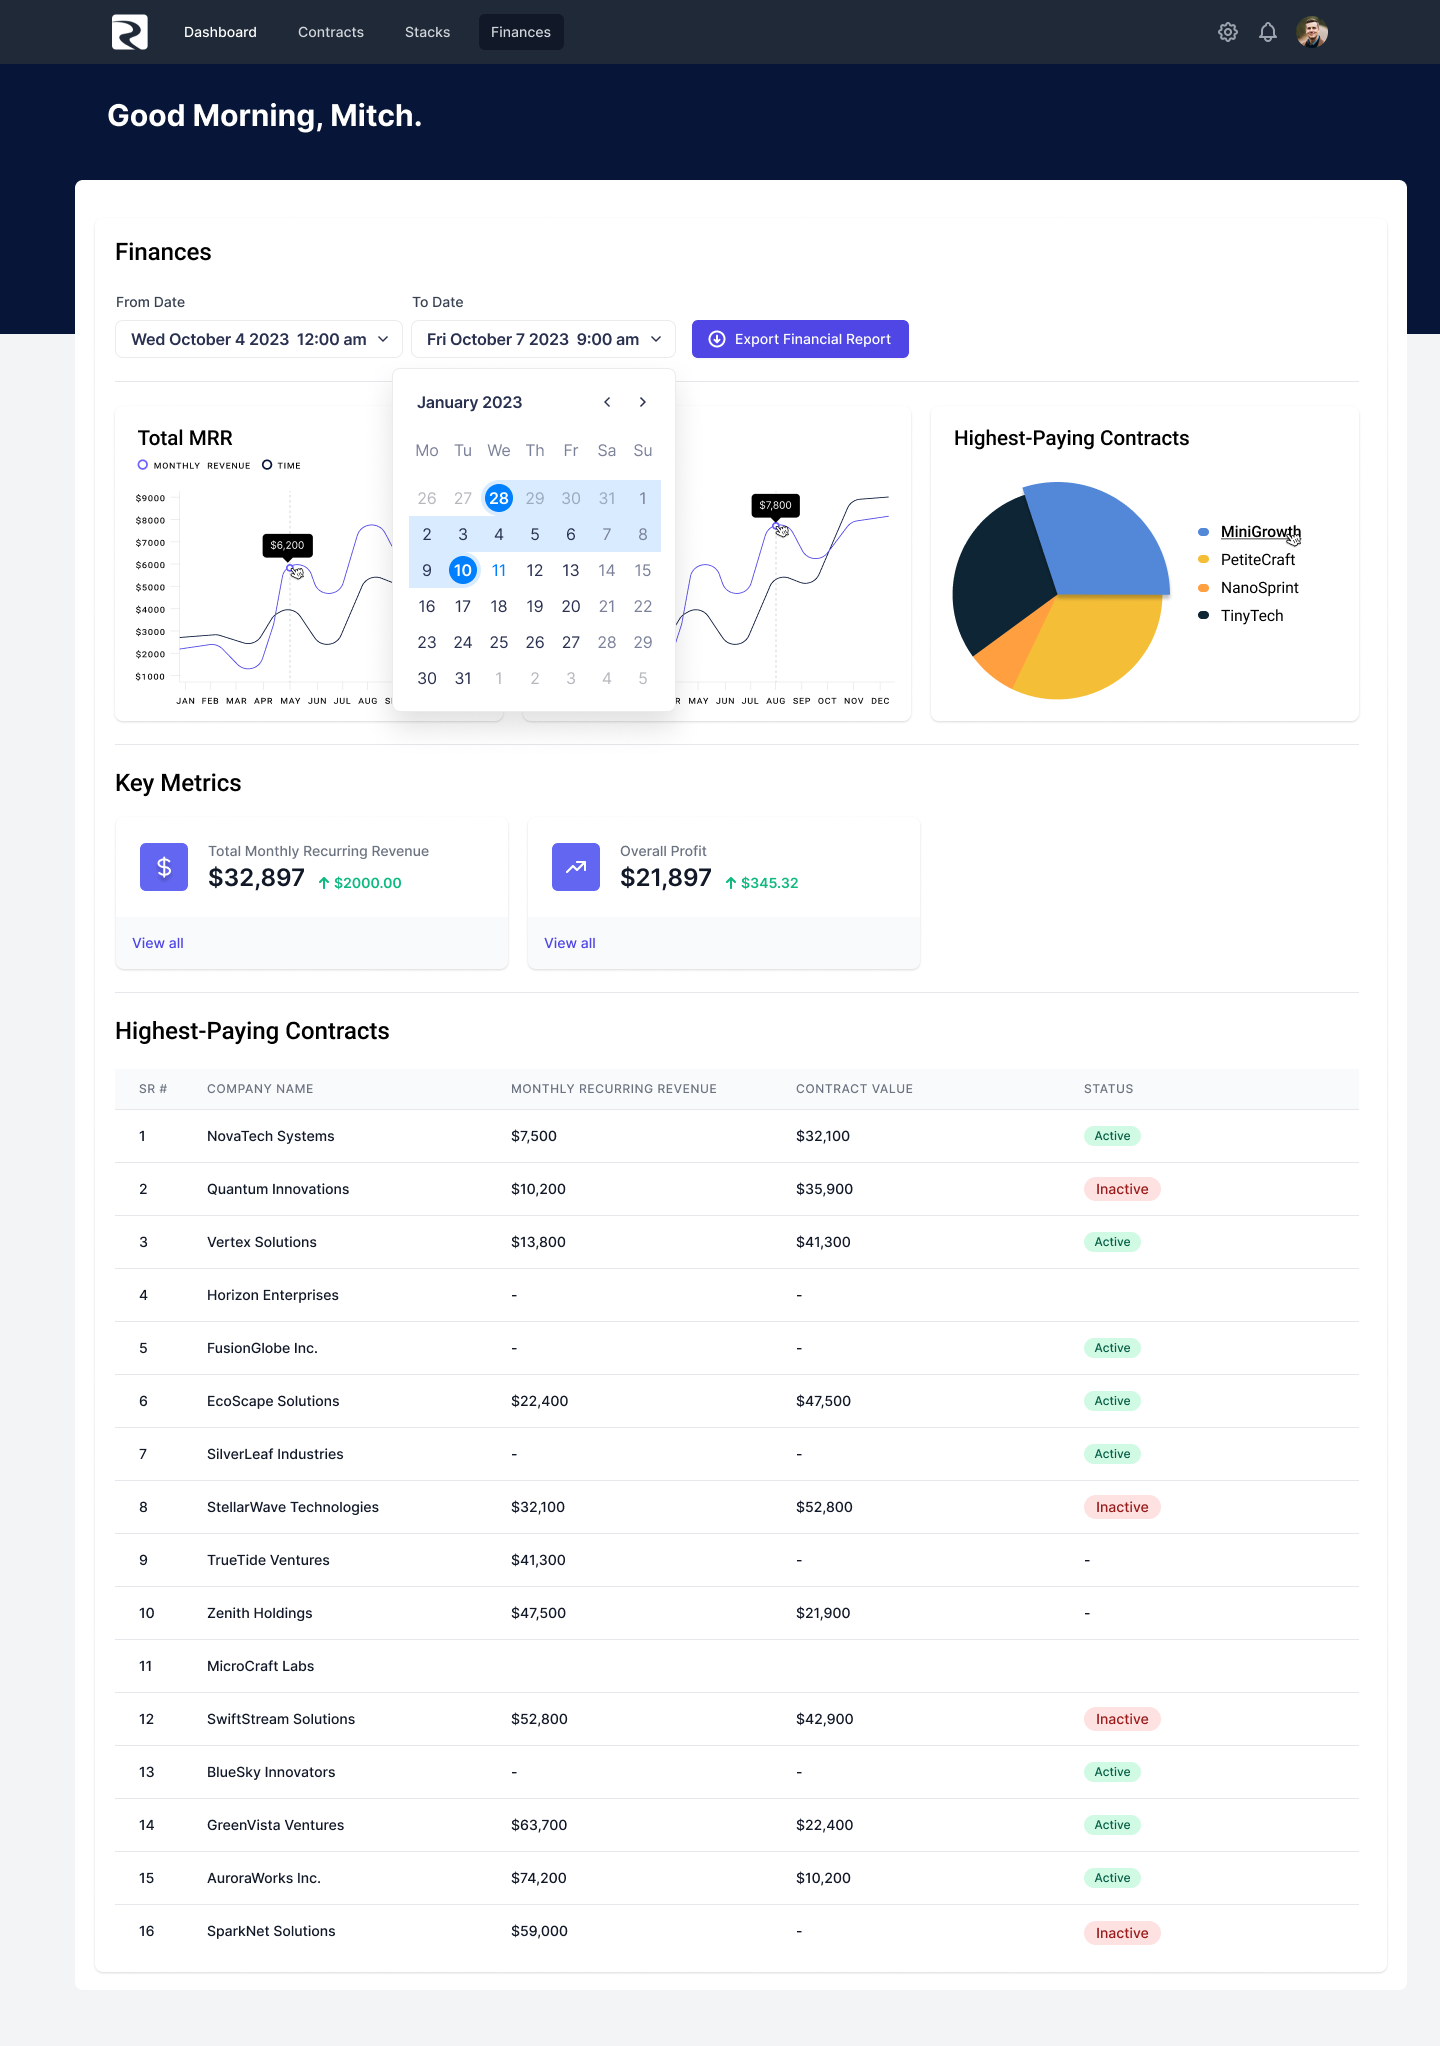
MSP Internal Operations Dashboard
Rivercity’s team manages dozens of businesses, hundreds of devices, and thousands of support tickets. The previous tools were scattered between multiple systems, causing delays and inefficiencies.
Core Dashboard Features
- Unified ticket management with priority visualization
- Device & endpoint health monitoring via clean status badges
- Client-by-client overview with at-a-glance KPIs
- Technician performance dashboard with time tracking
- Security alerts feed with severity-based sorting
- Role-based access system
Research & Discovery
- Interviews with 7 technicians & 3 managers
- Workflow mapping: tickets, escalations, device audits
- Identification of bottlenecks in response times
- Audit of existing ITSM tools (Syncro, NinjaOne, Autotask)
Design & Development
- Full custom dashboard UI/UX using component-driven design
- Modular layout for future expansion (alerts, billing, automation)
- High-contrast UI for long-hour usability
- Dark mode for technician comfort
- Reusable card, table, filter, and KPI components
Results & Impact
| Metric | Before | After | Improvement |
|---|---|---|---|
| Ticket Resolution Time | Baseline | ~35% faster | +35% |
| Technician Efficiency | Low visibility | Clear workload insights | +42% |
| Client Satisfaction | Unpredictable | Stable & measurable | +30% |